
The Illinois Report Card for the school year 2021 – 2022 has now been published at IllinoisReportCard.com and it’s chock full of information, though tedious to pull out the particulars. To see how the district fared, I compiled some of the key numbers: how each school did, on an overall basis and split out by demographic group, for two pre-pandemic and two post-pandemic years.
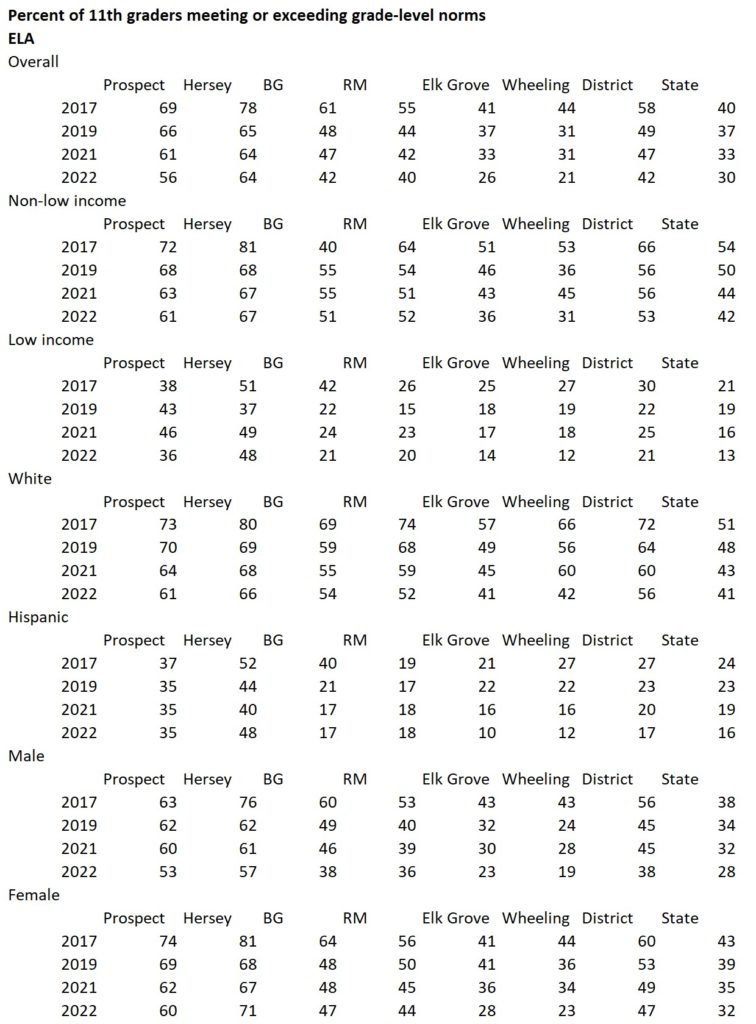
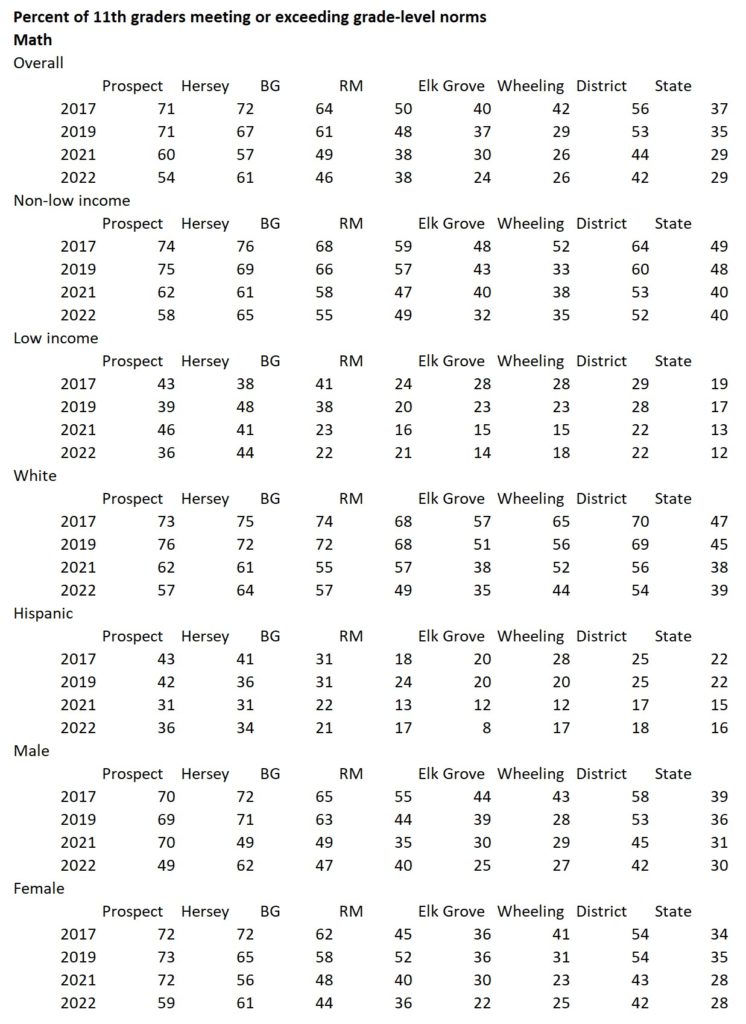
What do these numbers mean? The state of Illinois uses the SAT as its key measurement for high schools but rather than evaluating percentiles as a student would, they identify a score which is meant to represent an “11th grade level norm,” and report out the percent of students who meet or exceed this norm, separately for ELA (English/language arts) and math. The state further identifies cut-offs that represent working well-below vs. somewhat below grade level as well as at or well exceeding grade level (the labels they use are different, for example “partially meets” is a euphemism for the lowest category), and these are instructive, too — most notably, in ELA at two of the schools, 49% of Hispanic students score in this lowest category, and at another, 47% do; in math, the majority of low-income kids, district wide, and 56% of Hispanic kids in the district, score in this lowest category. This is, one presumes, the reason the district scored in the lowest of four categories for “student learning” in the new Equity Journey ratings.
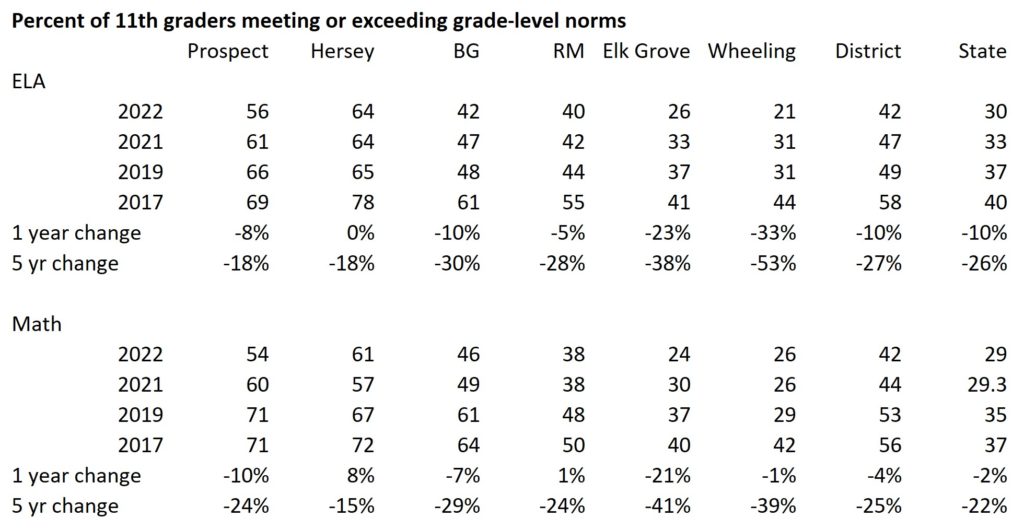
Also bear in mind that these scores are based on the SAT as taken by kids who were juniors last year, the first “normal” year of school after covid, and were sophomores during the prior year, when schools were wholly or partially shut. One might reasonably expect that scores would have improved from their counterparts the year prior, many of whom were wholly remote at the time with the exception of their SAT day, but across the district, ELA scores dropped by 10% and math scores by 4% (using this alternate form of measurement). Honestly, this surprised me, and my only guess as to an explanation is that even by a single year, younger kids were less able to learn remotely than older kids, so that remote learning was more harmful to a degree that the year back afterwards couldn’t compensate for.
Finally, by way of disclosure, these scores were all hand-typed, and it is possible that in any category I key in some numbers incorrectly. (Sigh . . . if the district were willing to share information, this wouldn’t be necessary.)
So without further ado: the District 214 Report Card results.
First, a five-year summary of scores:
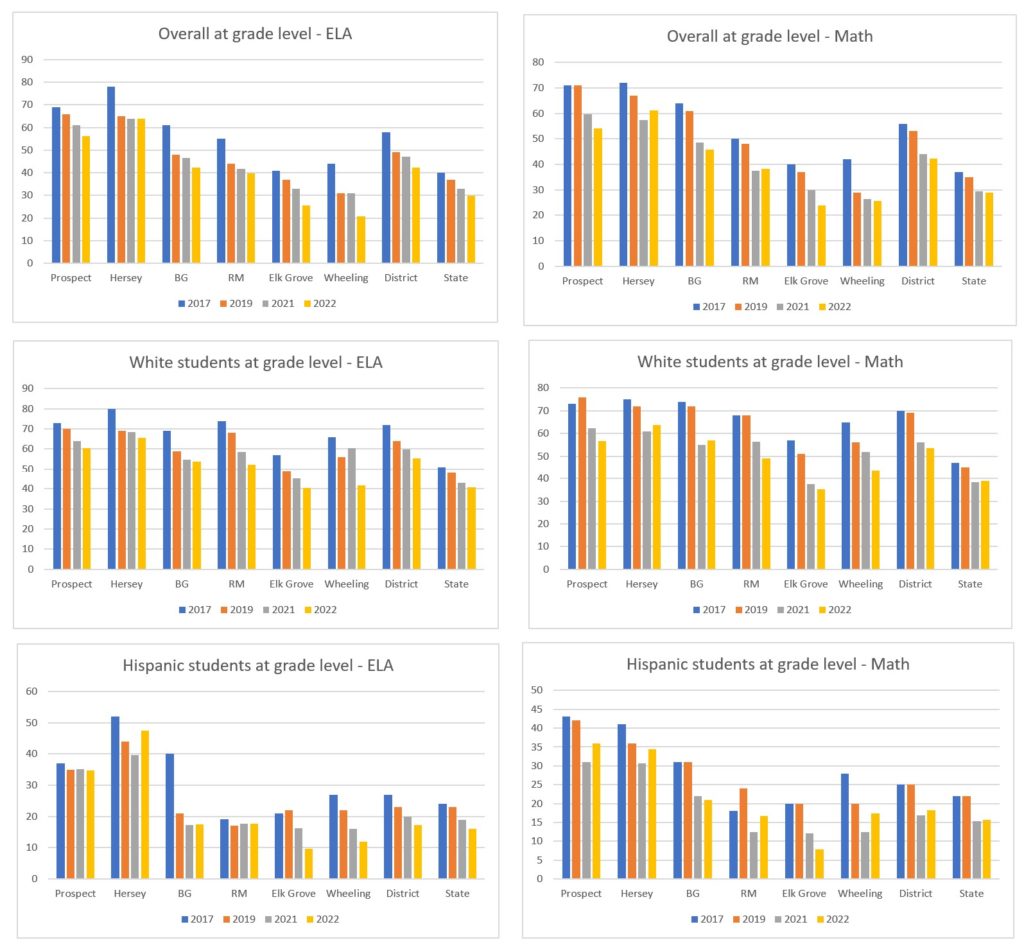
Second, some bar graphs to view the relative changes over time.
Third, a full compilation of data.
Whether these results are a cause for concern is, as my old actuarial textbooks used to say, “an exercise left to the reader.” Certainly there are plenty of parents who say, “I don’t care how other students are doing as long as I know the curriculum is solid for my own children, and I will make sure they do well even if their classmates don’t.” What do you say?